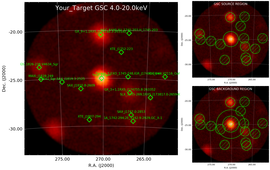
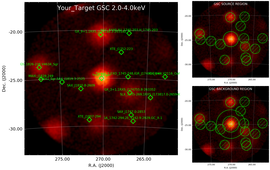
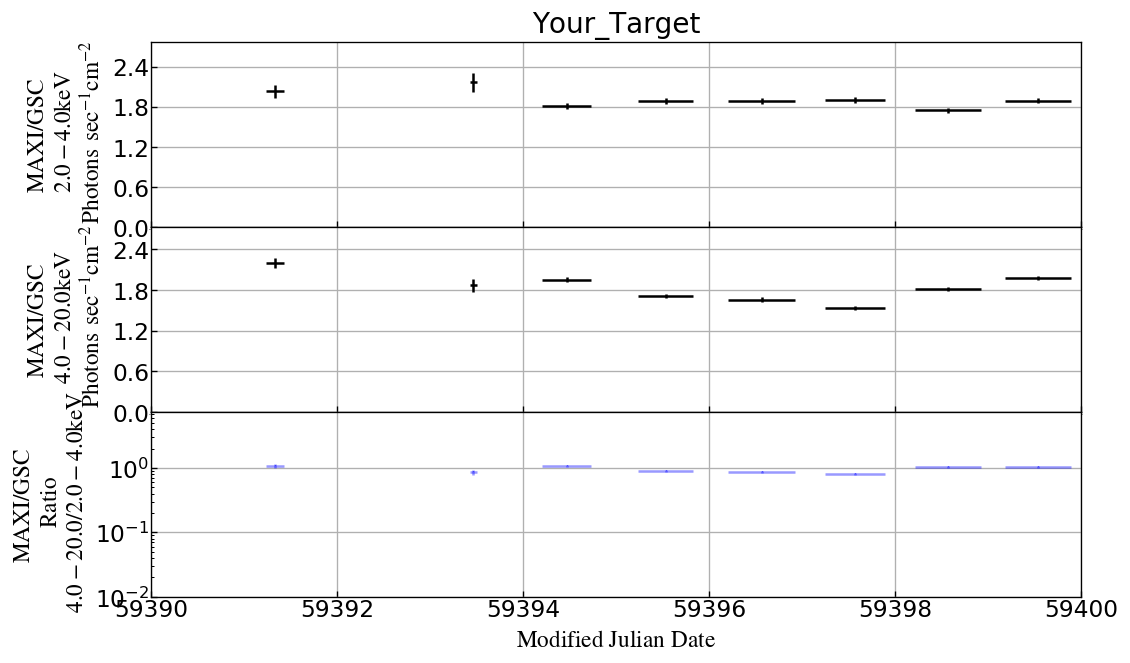
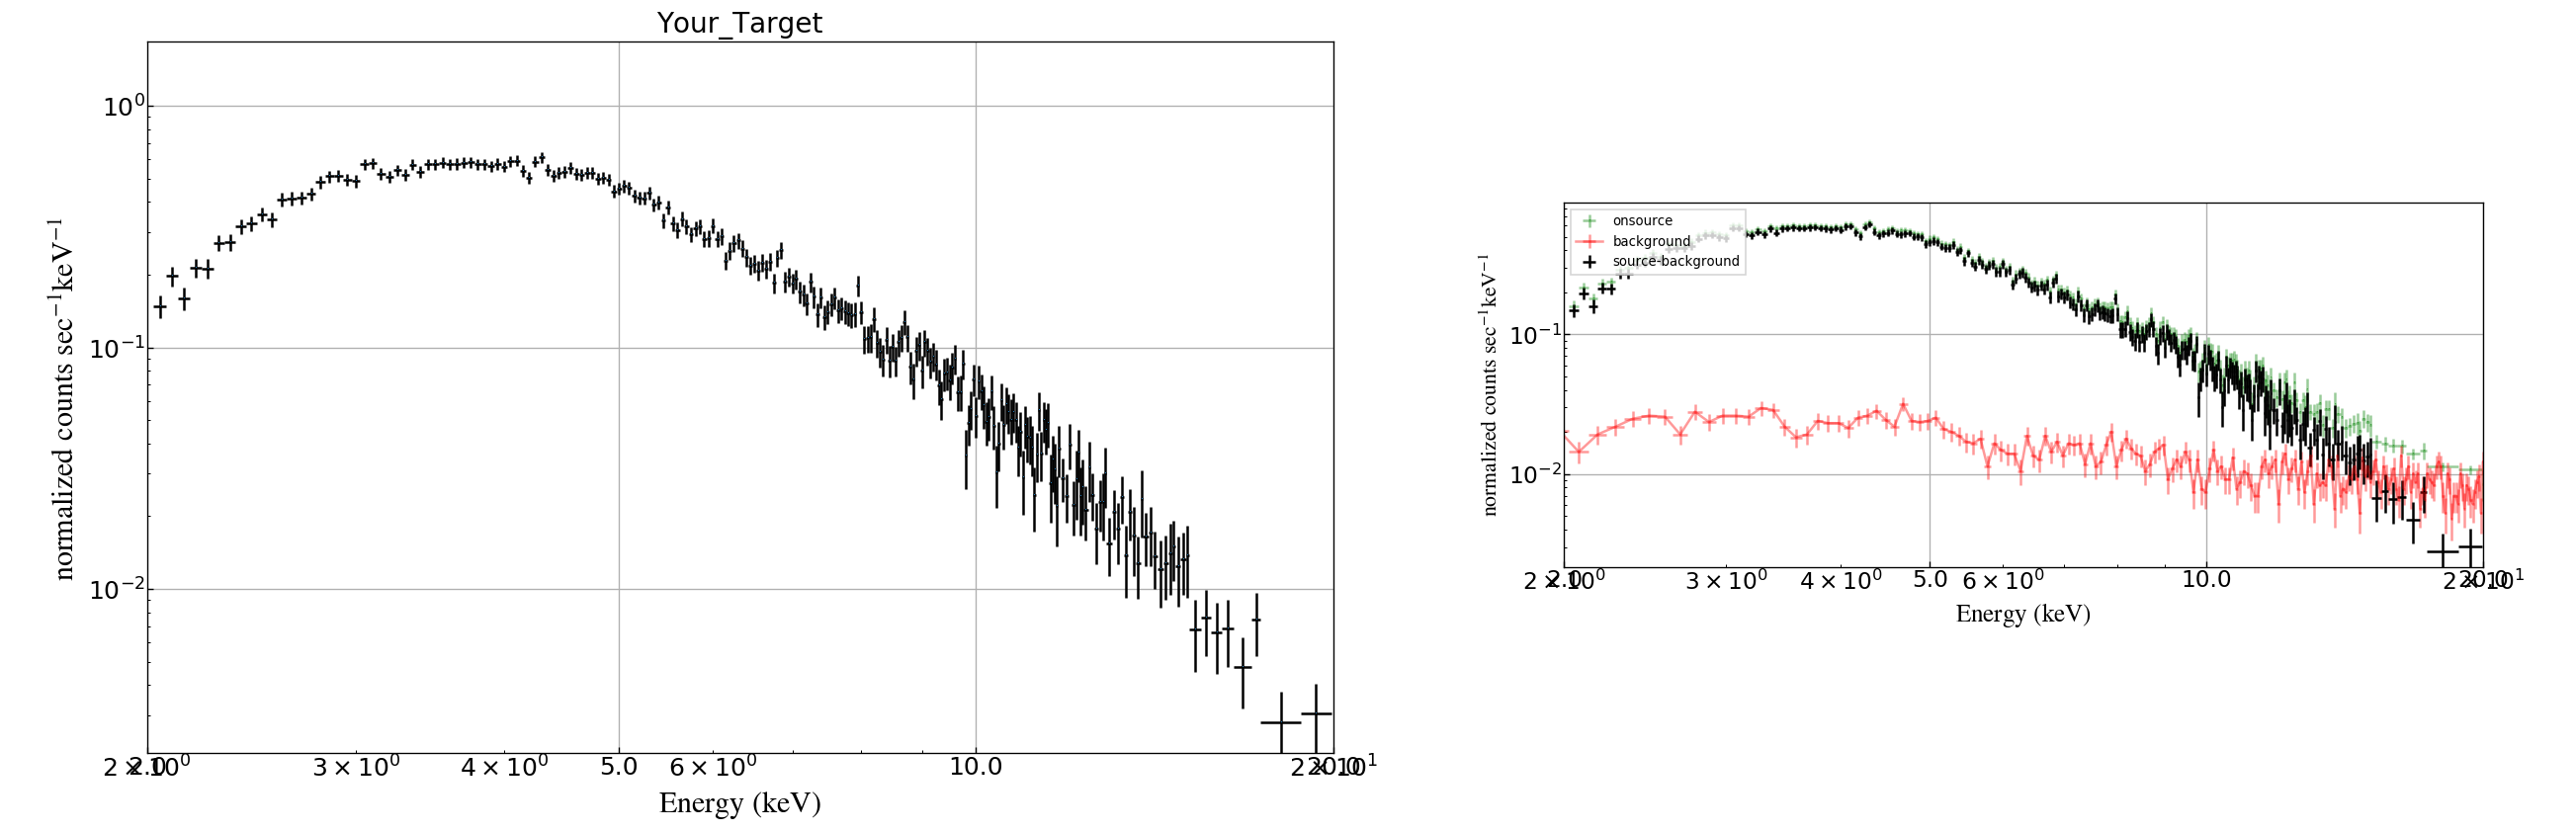
Your_Target
(R.A., Dec)=(270.284,-25.079)
MJD=59390.0 - 59400.0
Estimated Process time: 2.5 minutes
| 0:00:01 (extract) GSC Events(low) |
| 0:00:07 (extract) calculating GSC GTIs |
| 0:00:11 (building products) image |
| 0:00:30 (building products) light curve |
| 0:00:41 (building products) GSC spectrum |
| 0:00:44 (building products) GSC response |
nearbysources:
| 0.00 deg (270.284,-25.079) GX_5-1,1RXS_J180108.7-250444
2.42 deg (272.685,-26.15) SAX_J1810.8-2609
2.77 deg (267.233,-24.895) Terzan_5,EXO_1745-248,IGR_J17480-2446
3.32 deg (266.983,-26.564) GX_3+1,1RXS_J174755.8-263352
3.41 deg (268.063,-22.343) XTE_J1752-223
4.13 deg (274.84,-25.407) V4641_Sgr,SAX_J1819.3-2525
4.52 deg (271.749,-29.408) XTE_J1807-294
4.55 deg (270.385,-20.529) GX_9+1,1RXS_J180132.3-203132
4.93 deg (266.761,-28.883) SAX_J1747.0-2853
5.48 deg (264.571,-26.994) SLX_1735-269,1RXS_J173817.0-265940
5.50 deg (267.223,-20.362) NGC_6440,4U_1745-203,H_1745-203
5.55 deg (266.523,-29.515) 1A_1742-294,2E_1742.9-2929,GC_X-1
6.30 deg (277.243,-25.03) MAXI_J1828-249
6.57 deg (277.368,-23.797) GS_1826-238,V4634_Sgr
6.61 deg (263.008,-24.746) GX_1+4,V2116_Oph
|
LIGHT CURVE
SPECTRUM
Download spectrum and rmf files.
 Download Image and Region files.
