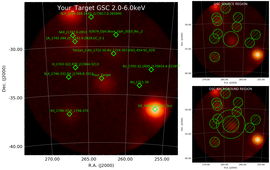
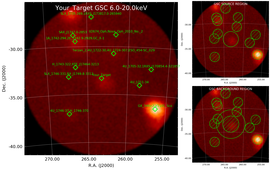
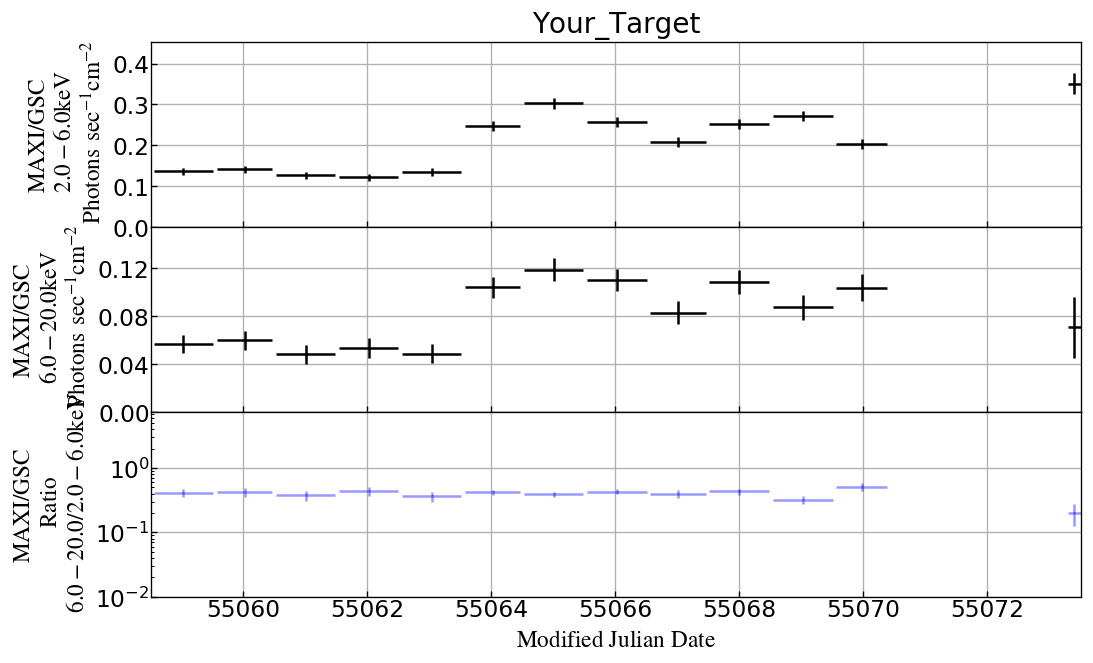
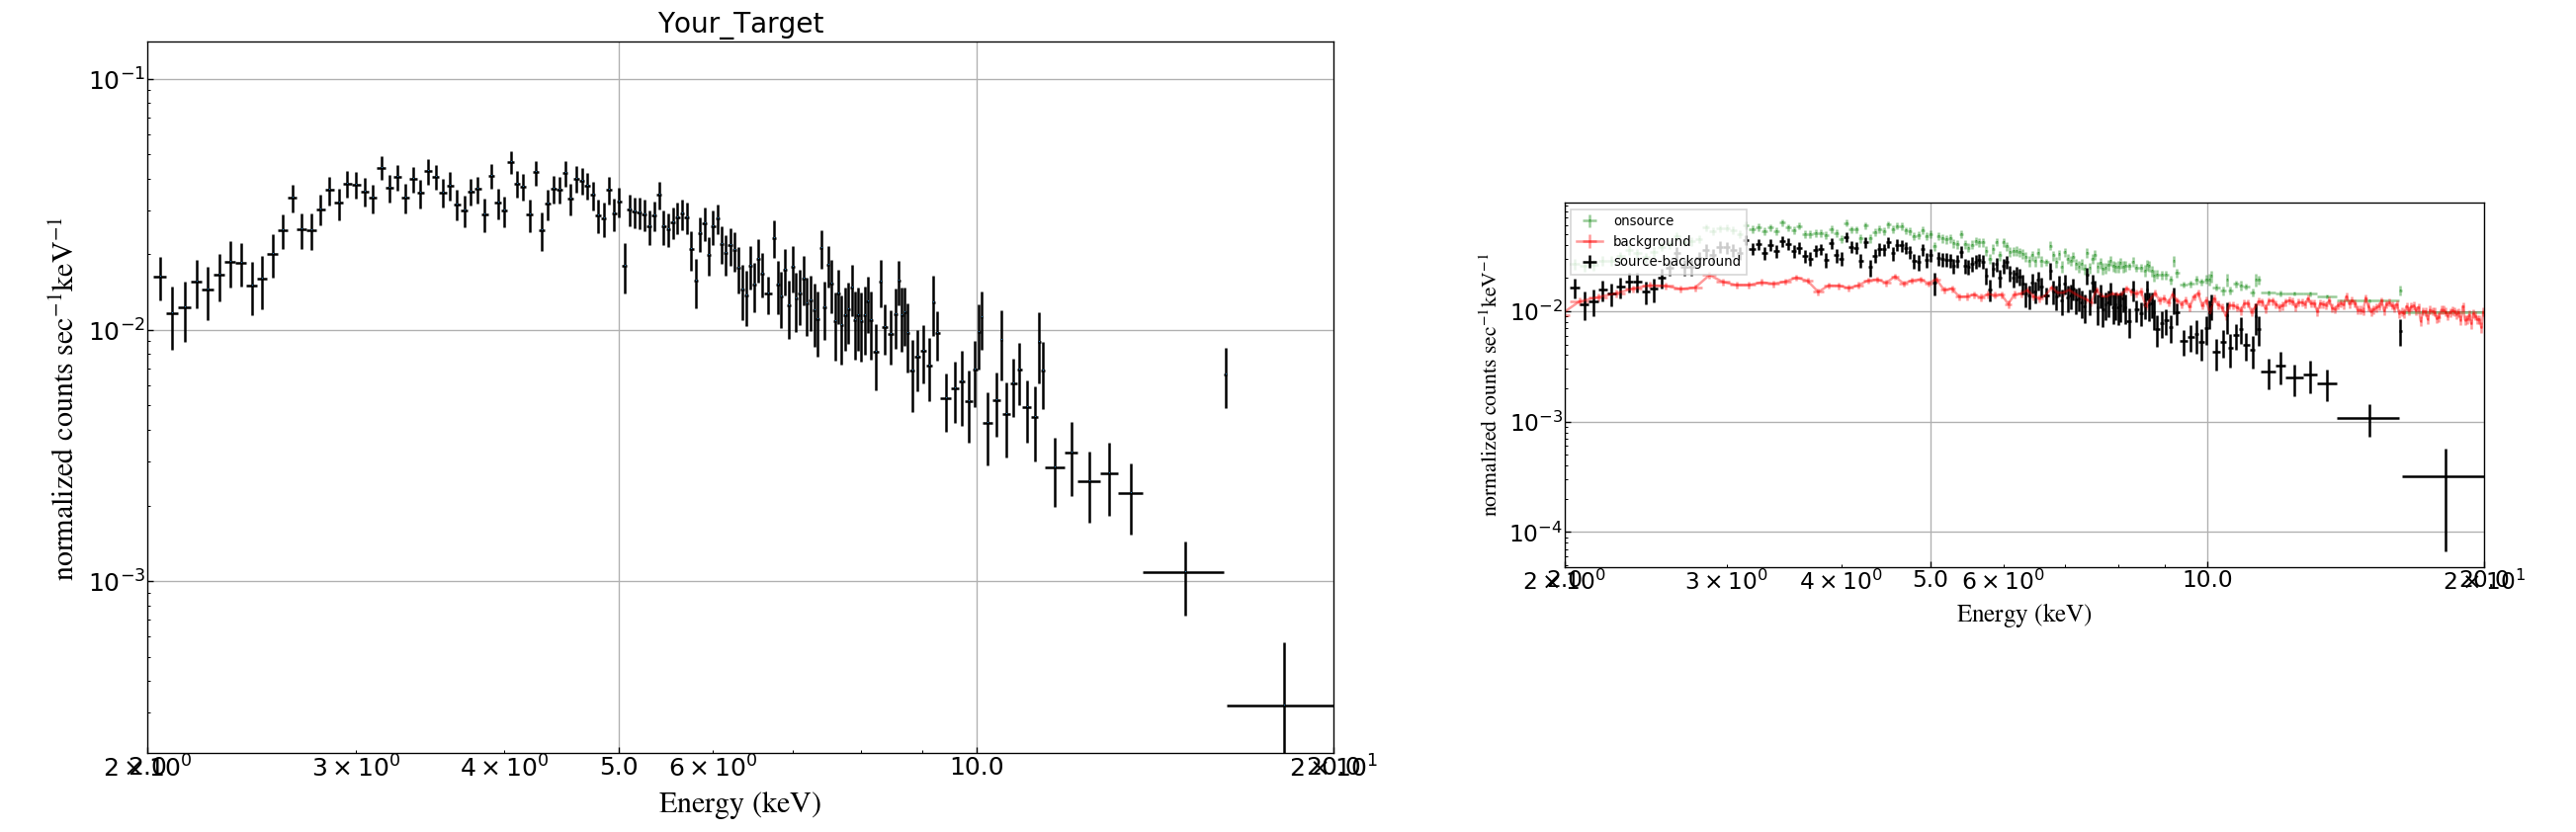
Your_Target
(R.A., Dec)=(263.352542,-33.388833)
MJD=55058.5242593 - 55073.5242593
Estimated Process time: 3.25 minutes
| 0:00:00 (extract) GSC Events(low) |
| 0:00:14 (extract) calculating GSC GTIs |
| 0:00:22 (building products) image |
| 0:00:45 (building products) light curve |
| 0:01:04 (building products) GSC spectrum |
| 0:01:07 (building products) GSC response |
nearbysources:
| 0.00 deg (263.35,-33.388) H_1730-333_Rapid-Burster_with_Slow-Burster
0.54 deg (262.989,-33.835) GX_354-0_Slow-Burster_with_Rapid-Burster,4U_1728-3
2.87 deg (261.888,-30.803) Terzan_2,4U_1722-30,4U_1724-307,ESO_454-SC_029
2.94 deg (266.565,-32.233) H_1743-322,XTE_J17464-3213
3.43 deg (267.452,-33.204) SLX_1746-331,RX_J1749.8-3312
4.02 deg (258.58,-34.049) 4U_1711-34
4.72 deg (266.523,-29.515) 1A_1742-294,2E_1742.9-2929,GC_X-1
4.79 deg (261.634,-28.828) V2674_Oph,Nova_Oph_2010_No._2
5.02 deg (267.553,-37.052) 4U_1746-37,H_1746-370
5.25 deg (257.226,-32.333) 4U_1705-32,1RXS_J170854.4-321857
5.37 deg (266.761,-28.883) SAX_J1747.0-2853
6.43 deg (256.435,-36.423) GX_349+2,V1101_Sco
6.48 deg (264.571,-26.994) SLX_1735-269,1RXS_J173817.0-265940
|
LIGHT CURVE
SPECTRUM
Download spectrum and rmf files.
 Download Image and Region files.
